What is Analytics Engineering?
As the data domain has developed over time, new tools have been introduced that have changed the dynamics of working with data:
- Massively parallel processing (MPP) databases
- Lower the cost of storage
- BigQuery, Snowflake, Redshift, etc.
- Data-pipelines-as-a-service
- Simplify the ETL process
- Fivetran, Stitch, etc.
- SQL-first / Version control systems
- Self service analytics
- Data governance
The introduction of all of these tools changed the way the data teams work as well as the way that the stakeholders consume the data, creating a gap in the roles of the data team. Traditionally:
- The data engineer prepares and maintains the infrastructure the data team needs.
- The data analyst uses data to answer questions and solve problems.
- The data scientist predicts the future based on past patterns and covers the what-ifs.
However, with the introduction of these tools, both data scientists and analysts find themselves writing more code even though they’re not software engineers and writing code isn’t their top priority. Data engineers are good software engineers but they don’t have the training in how the data is going to be used by the business users.
The analytics engineer is the role that tries to fill the gap: it introduces the good software engineering practices to the efforts of data analysts and data scientists. The analytics engineer may be exposed to the following tools:
- Data Loading (Stitch…)
- Data Storing (Data Warehouses)
- Data Modeling (dbt, Dataform…)
- Data Presentation (BI tools like Looker, Mode, Tableau…)
This lesson focuses on the last two parts: Data Modeling and Data Presentation.
Data Modeling Concepts
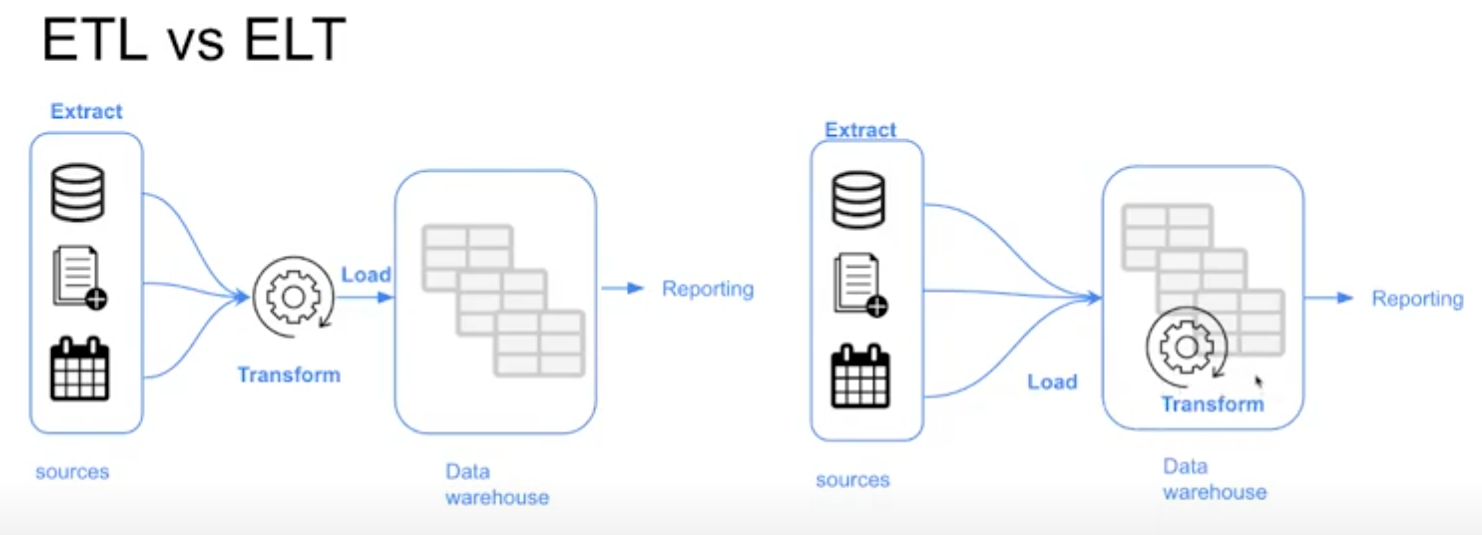
ETL vs. ELT
When ingesting data, Data Warehouses use the Export, Transform and Load (ETL) model whereas Data Lakes use Export, Load and Transform (ELT).
The main difference between them is the order of steps. In Data Warehouses, ETL means the data is transformed (preprocessed, etc.) before arriving to its final destination, whereas in Data Lakes, ELT the data is directly stored without any transformations and any schemas are derived when reading the data from the Data Lake.
Dimensional Modeling
Ralph Kimball’s Dimensional Modeling is an approach to Data Warehouse design which focuses on two main points:
- Deliver data which is understandable to the business users
- Deliver fast query performance
Other goals such as reducing redundant data (prioritized by other approaches like Bill Inmon) are secondary to these goals. Dimensional Modeling also differs from other approaches to Data Warehouse design such as Data Vaults.
Dimensional Modeling is based around two important concepts:
- Fact Table:
- Facts = Measures
- Typically numeric values which can be aggregated, such as measurements or metrics
- Examples: sales, orders, etc.
- Corresponds to a business process
- Can be thought of as “verbs”
- Dimension Table:
- Dimension = Context
- Groups of hierarchies and descriptors that define the facts
- Example: customer, product, etc.
- Corresponds to a business entity.
- Can be thought of as “nouns”
- Dimensional Modeling is built on a star schema with fact tables surrounded by dimension tables
A good way to understand the architecture of Dimensional Modeling is by drawing an analogy between dimensional modeling and a restaurant:
- Stage Area:
- Contains the raw data
- Not meant to be exposed to everyone
- Similar to the food storage area in a restaurant
- Processing area:
- From raw data to data models
- Focuses in efficiency and ensuring standards
- Similar to the kitchen in a restaurant
- Presentation area:
- Final presentation of the data
- Exposure to business stakeholder
- Similar to the dining room in a restaurant
What is “dbt”?
DBT (Data Build Tool) is an open-source software application that enables data analysts and engineers to transform data in their warehouses more effectively.
It acts as a workflow tool that allows teams to easily define, run and test data modelling code, primarily written in SQL, to organise, cleanse and transform their data.
Using DBT over writing SQL manually for data transformations in a data warehouse has several advantages that improve efficiency, scalability and reliability of data workflows.
While SQL is powerful for querying and manipulating data, DBT adds a layer of functionality that addresses common challenges in data engineering and analytics projects.
How to use dbt?
dbt has two main components: dbt Core and dbt Cloud:
- dbt Core: open-source project that allows the data transformation
- Builds and runs a dbt project (.sql and .yaml files)
- Includes SQL compilation logic, macros and database adapters
- Includes a CLI interface to run dbt commands locally
- dbt Cloud: SaaS application to develop and manage dbt projects
- Web-based IDE to develop, run and test a dbt project
- Jobs orchestration
- Logging and alerting
- Intregrated documentation
I will use the dbt Cloud IDE.
dbt model
The dbt model is essentially a SQL query or expression that defines how data should be transformed, aggregated or organised for analysis. Along with the query, a dbt model includes a block of code at the beginning under Jinja notation, recognisable by the double brackets . Within this block, the config() dbt function is typically used to specify the persistence strategy of the dbt model in the target database.
By default, there are four ways to materialise queries:
- table: Model data is persisted in a table on the warehouse.
- view: Similar to the previous one, but instead of a table, it is a view.
- incremental: These models allow dbt to insert and/or update records in a model table if they have changed since the last time it was run.
- ephemeral: They do not generate an object directly in the database; instead, they create a CTE (Common Table Expression), which is a temporary subquery to use in other queries (such as WITH SQL Server).
To build the model, you need to execute the command “dbt build”. If you don’t include any parameters, dbt will compile and build all the models. To specify that you only want to build a specific one, you can add the parameter “–select”.
Sources
In dbt, sources are configurations that define how to connect to external data systems or databases, especially when the source is a database table (BigQuery). These configurations are typically specified in a schema.yml file, which needs to be created in the same directory as the model you’re working on.
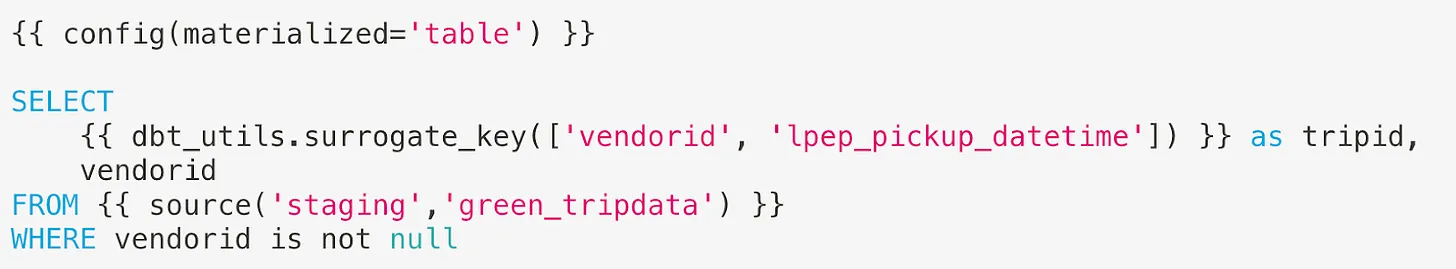
When building the model, you’ll use a jinja macro notation to replace the “schema.table name” in your SQL queries with a reference to the configuration defined in the schema.yml file. This allows dbt to dynamically fetch the data from the specified source. For example:
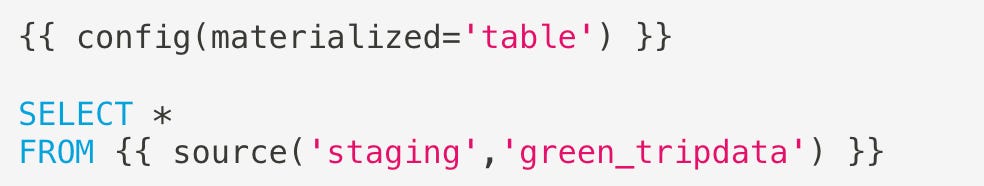
The schema.yml file contains important details such as the version, source name, database, schema and tables. By keeping this configuration separate from the models, it offers the advantage of centralising connection details. This means you can easily change the connection for all models by updating just one file, providing greater flexibility and ease of maintenance in your dbt project.
Seeds
Seeds are like special files (usually CSV) in your dbt project that hold data you want to put into your database. They live in a folder called “seeds” in your dbt project. It’s a good idea to use seeds for data that doesn’t change much.
To make a seed, you just need to upload a CSV file into the “seeds” folder in your project. For our project we have a file called “taxi_zone_lookup.csv”. You can then run a command in dbt like “dbt seed taxi_zone_lookup.csv”. This command tells dbt to take the data from your CSV file and put it into a table in your database. Easy, right?
Macros
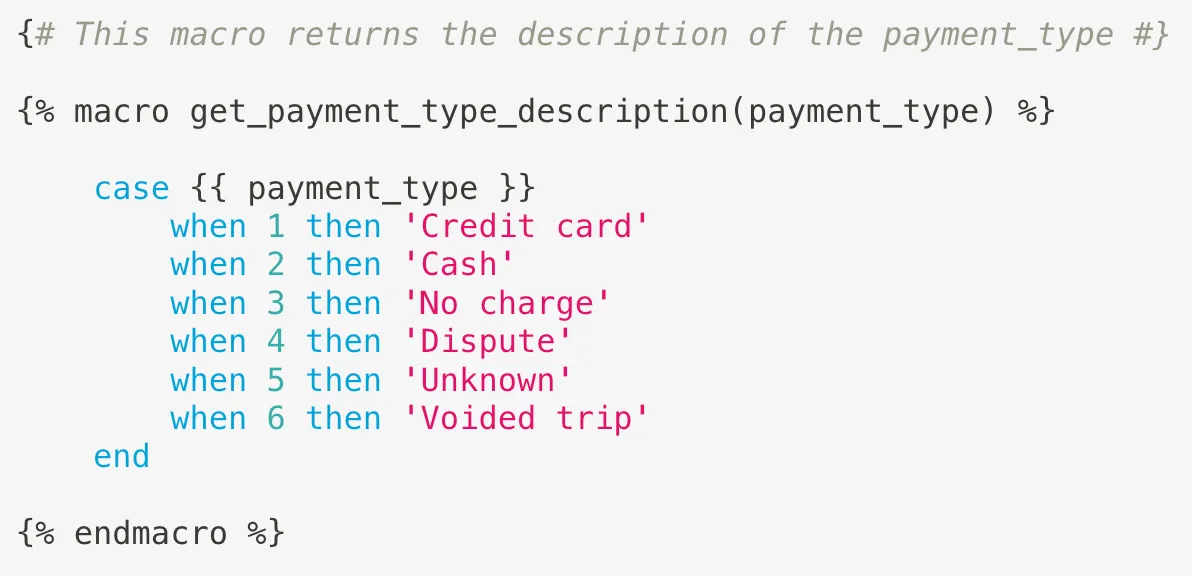
Macros in dbt are like reusable pieces of code that you can use over and over again in your data transformations. Think of them as similar to functions in other programming languages. They’re super handy when you find yourself writing the same code in multiple models. You define macros in .sql files located in the macros directory of your dbt project.
For example, for our project we are going to create a macro called “get_payment_type_description”. This macro takes a value from the “payment_type” column as input and uses a CASE WHEN statement to return the corresponding description. We define this macro in a .sql file and then we can use it in various models throughout our project. It’s a great way to keep our code organised and avoid repeating ourselves.
Packages
It allows us to reuse macros between different projects, similar to libraries or modules in other programming languages. To use a package in your project, create a packages.yml configuration file in the root directory of your dbt project.
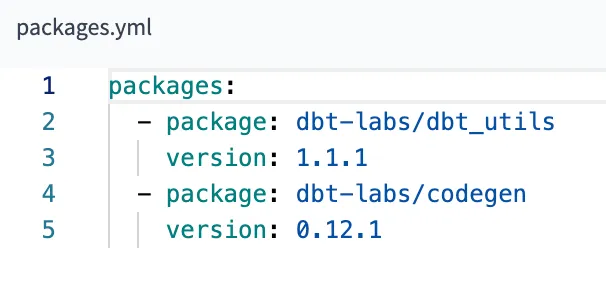
Dbt is going to install them automatically with command dbt deps.
The dbt-utils package for example includes the macro surrogate_key to create a surrogate key.
With the codegen package you can configure your dbt project to automatically generate documentation in web format and published in dbt cloud.
It is going to generate documentation for all tales in the staging models. Change staging to core and you are going to get documentation for tables in the core models.
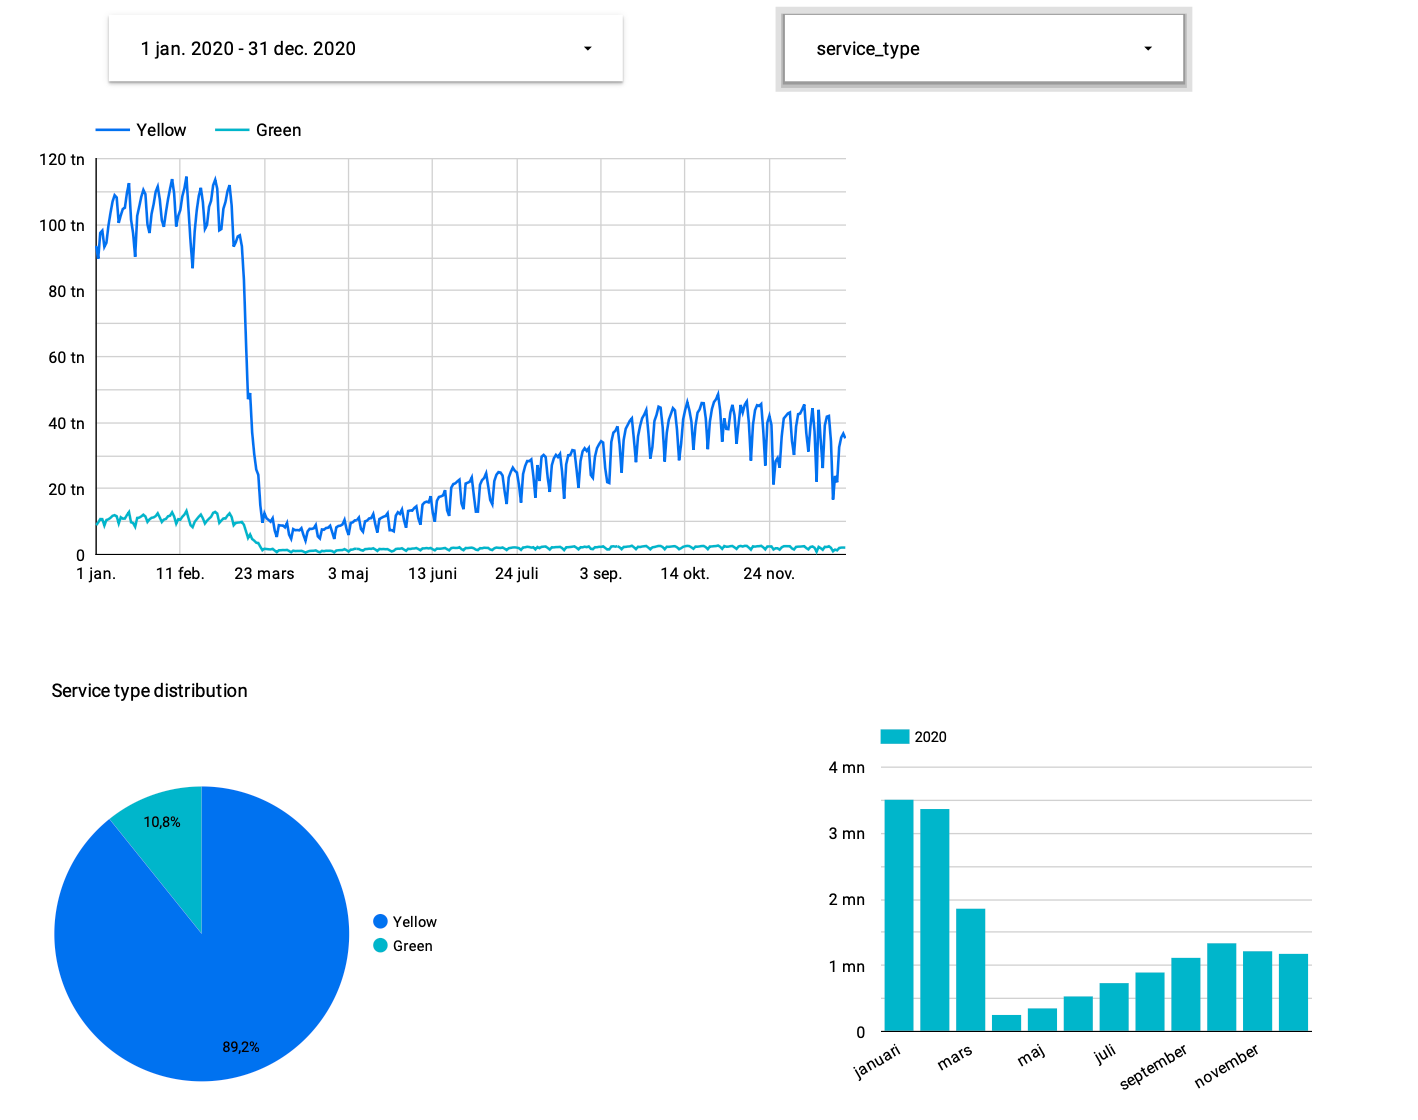
Looker Studio
Looker Studio provides a user-friendly interface for building and customising dashboards and reports without needing to write any code.
With Looker Studio, users can:
- Design Dashboards: Easily drag and drop visualisations, charts, and widgets onto a canvas to create interactive dashboards.
- Customise Reports: Customise the appearance and layout of reports to suit specific needs and preferences.
- Explore Data: Explore and analyse data visually using intuitive tools and filters.
- Collaborate: Share dashboards and reports with team members, collaborate on insights, and make data-driven decisions together.
- Embed: Embed dashboards and reports into other applications or websites for wider distribution and accessibility.
There are two types of elements: reports and data sources. The first are the dashboards with the visualisations and the second are the connectors with the tables of the source systems. The first step to generate a dashboard is to configure the data sources.
When you choose the table you can start designing your beautiful dashboards.